


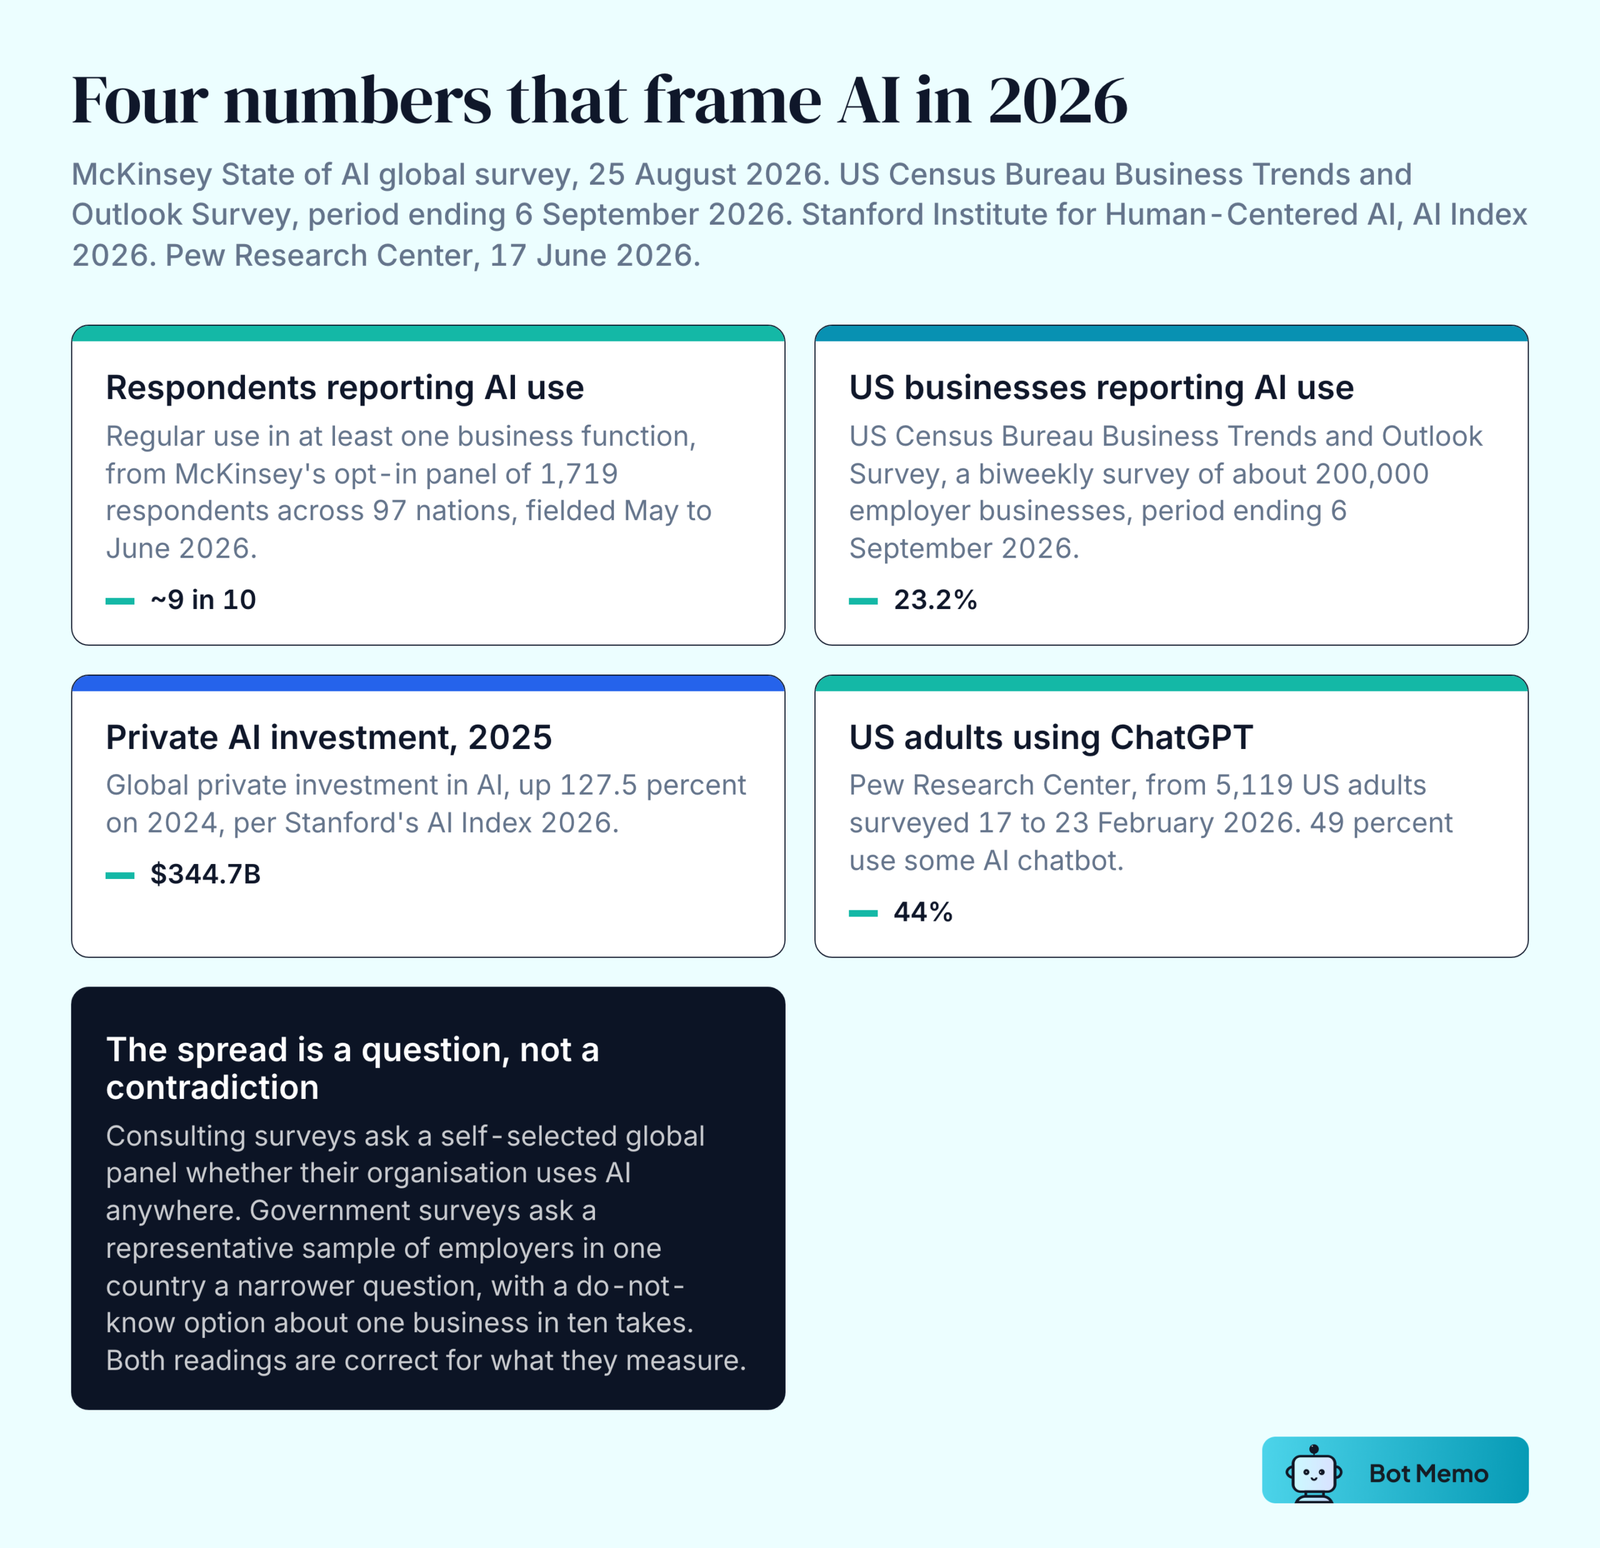
McKinsey’s 2026 global survey, published on 25 August 2026, found that nearly nine in ten respondents report their organisation uses AI regularly in at least one business function. The US Census Bureau, putting a narrower question to a representative sample of American employers in the collection period ending 6 September 2026, got a little under one in four.
Both numbers are accurate. They ask different questions of different populations, and almost every argument about “the real AI adoption rate” comes down to that gap.
Below are 100 figures on how many organisations use AI, how much money went into it, what the models can do, how ordinary people use them, and what has actually happened to jobs. Each one carries the organisation that published it, the date, and the population it measures.
On this page
- Key AI Statistics For 2026
- AI Adoption Statistics: How Many Organisations Actually Use It
- AI Investment And Market Size Statistics
- Generative AI And Model Statistics
- AI Usage Statistics: What Consumers Actually Do
- AI And Jobs Statistics
- AI Trust, Sentiment And Regulation Statistics
- Key Takeaways
- Frequently Asked Questions
- Sources And Methodology
Key AI Statistics For 2026
- Nearly nine in ten survey respondents report regular AI use in at least one business function, but only 44% say AI is scaling across the enterprise. (McKinsey, August 2026)
- 23.2% of US businesses reported using AI in a business function in the survey period ending 6 September 2026, up from 19.8% in early May. (US Census Bureau)
- 37% of respondents attribute any EBIT impact to AI, unchanged from a year earlier. 6% qualify as high performers. (McKinsey, August 2026)
- Global corporate AI investment reached $581.7 billion in 2025, up 130% on 2024. (Stanford HAI)
- 44% of US adults say they use ChatGPT, more than double the 2023 share. 49% use some AI chatbot. (Pew Research Center, June 2026)
- 14% of organisations using AI say it contributed to a workforce decline in the past year, against the 32% who expected one. (McKinsey, August 2026)
- Bot Memo’s repository recorded $513.3 billion across 3,860 AI startup rounds in the first seven months of 2026, more than the whole of 2025.
- 80% of survey respondents say AI improved their individual productivity. 50% say it helps them make better decisions. (McKinsey, August 2026)
- 63% of Americans say AI is advancing too quickly. 71% expect it to make personal information less secure. (Pew Research Center, June 2026)
- 170 million new roles and 92 million displaced roles are projected by 2030, a net gain of 78 million, across all the macrotrends the forecast covers rather than AI alone. (World Economic Forum, January 2025)
AI Adoption Statistics: How Many Organisations Actually Use It
Nearly Nine In Ten Respondents Report Regular AI Use
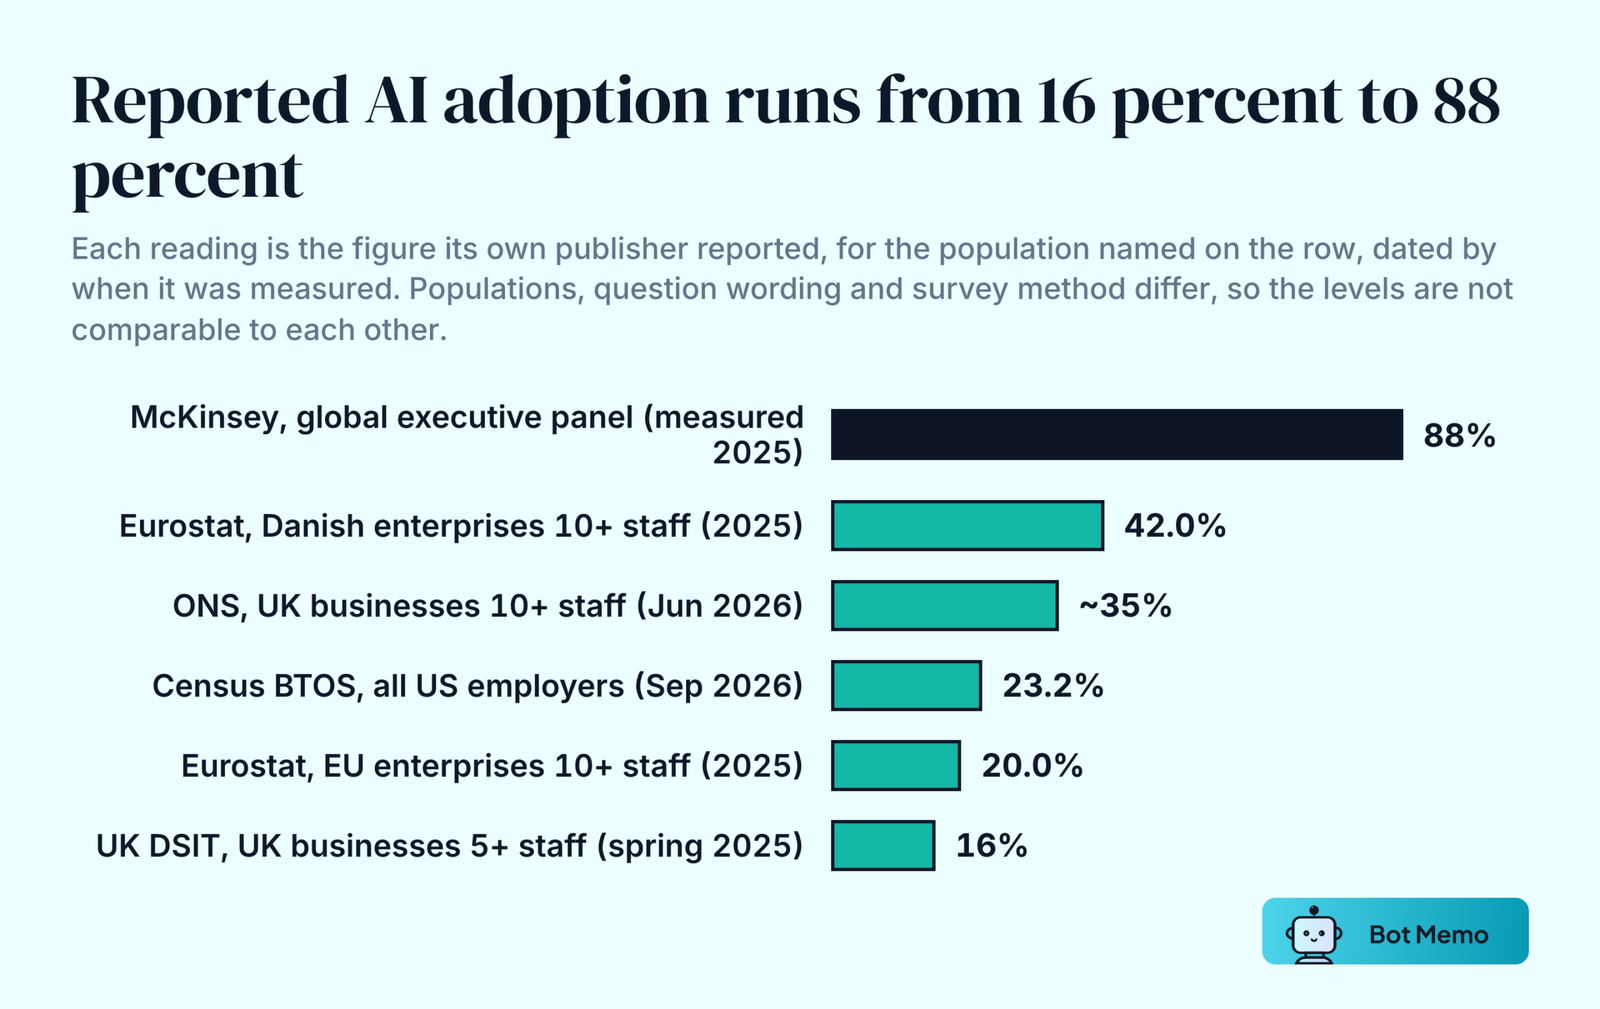
- Nearly nine in ten respondents report their organisation regularly uses AI in at least one business function. (McKinsey & Company, 25 August 2026)
- 44% say AI is scaling across the enterprise, up from 38% a year earlier.
- 56% use AI in three or more business functions, up from 51%.
- 47% say their organisation is scaling AI chatbots across the enterprise, the most widely scaled tool in the survey.
- 28% spend more than 10% of their enterprise-wide information and communications technology budget on AI.
- 60% expect their organisation to increase AI investment over the next year.
- 20% say AI operating costs, including token costs, have constrained their use of it.
- The 2026 edition rests on 1,719 responses from 97 nations, collected between 4 May and 8 June 2026. 36% of respondents work at organisations above $1 billion in annual revenue.
- McKinsey’s own reported adoption trajectory across editions runs 55% (fielded April 2023), 72% (fielded February to March 2024), 78% (fielded July 2024, published March 2025) and 88% (fielded June to July 2025, published November 2025). Those are four surveys, not four calendar years, and the 78% and 72% readings came from waves fielded in the same year. The wording left “adopted” undefined in every edition, so a single employee experimenting counts the same as an enterprise deployment.
Government Surveys Put US Business Use Near One In Four
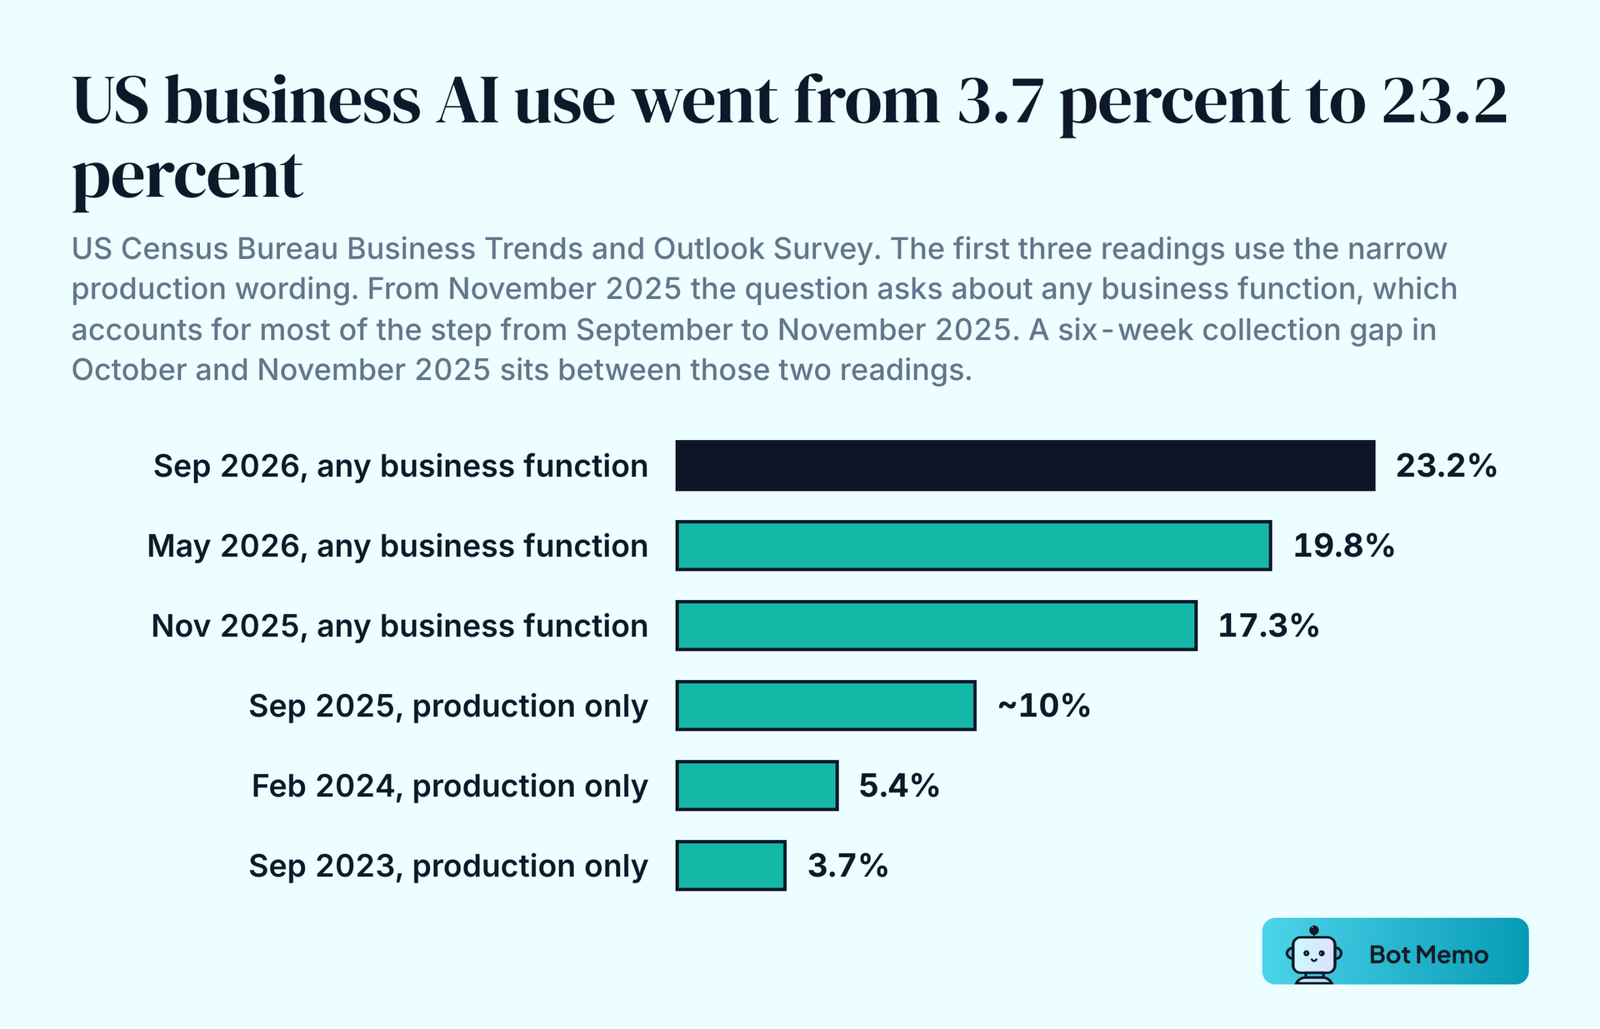
- 23.2% of US businesses reported current AI use in the collection period ending 6 September 2026, up from 19.8% in the period ending 3 May 2026. (US Census Bureau)
- Across December 2025 to September 2026 the rate climbed from 17.8% to 23.2%, with one 1.4-point dip in February 2026 and no other fall above half a point. 27.3% now expect to use AI within six months.
- The Census Bureau surveys roughly 200,000 businesses every two weeks and offers three answers, yes, no, or do not know, worded since November 2025 to cover any business function. 9.6% answer do not know, so the non-users are a smaller group than the headline rate’s complement implies.
- Earlier readings on the narrow production wording were 3.7% (September 2023), 5.4% (February 2024) and about 10% (September 2025).
- When the Census broadened the question from production to any business function in November 2025, the measured rate moved from about 10% to 17.3%.
- 16% of UK private-sector businesses with five or more employees were using at least one AI technology when the Department for Science, Innovation and Technology ran its AI Adoption Research, and 80% neither used nor planned to. The fieldwork ran February to May 2025 and the report came out on 28 January 2026. (UK Department for Science, Innovation and Technology, from 3,500 telephone interviews)
- The Office for National Statistics, asking businesses of ten or more employees on a different survey, put UK AI use at about 35% in late June 2026, up from about 12% in late 2023. The UK therefore has two official readings, 16% and 35%, measured on different instruments and different size thresholds more than a year apart. (Office for National Statistics, 20 July 2026)
- EU enterprise adoption rose from 8.1% in 2023 to 13.5% in 2024 to 20.0% in 2025. (Eurostat, 11 December 2025, from 157,000 enterprises sampled by national statistical institutes)
Company Size Still Decides Most Of It
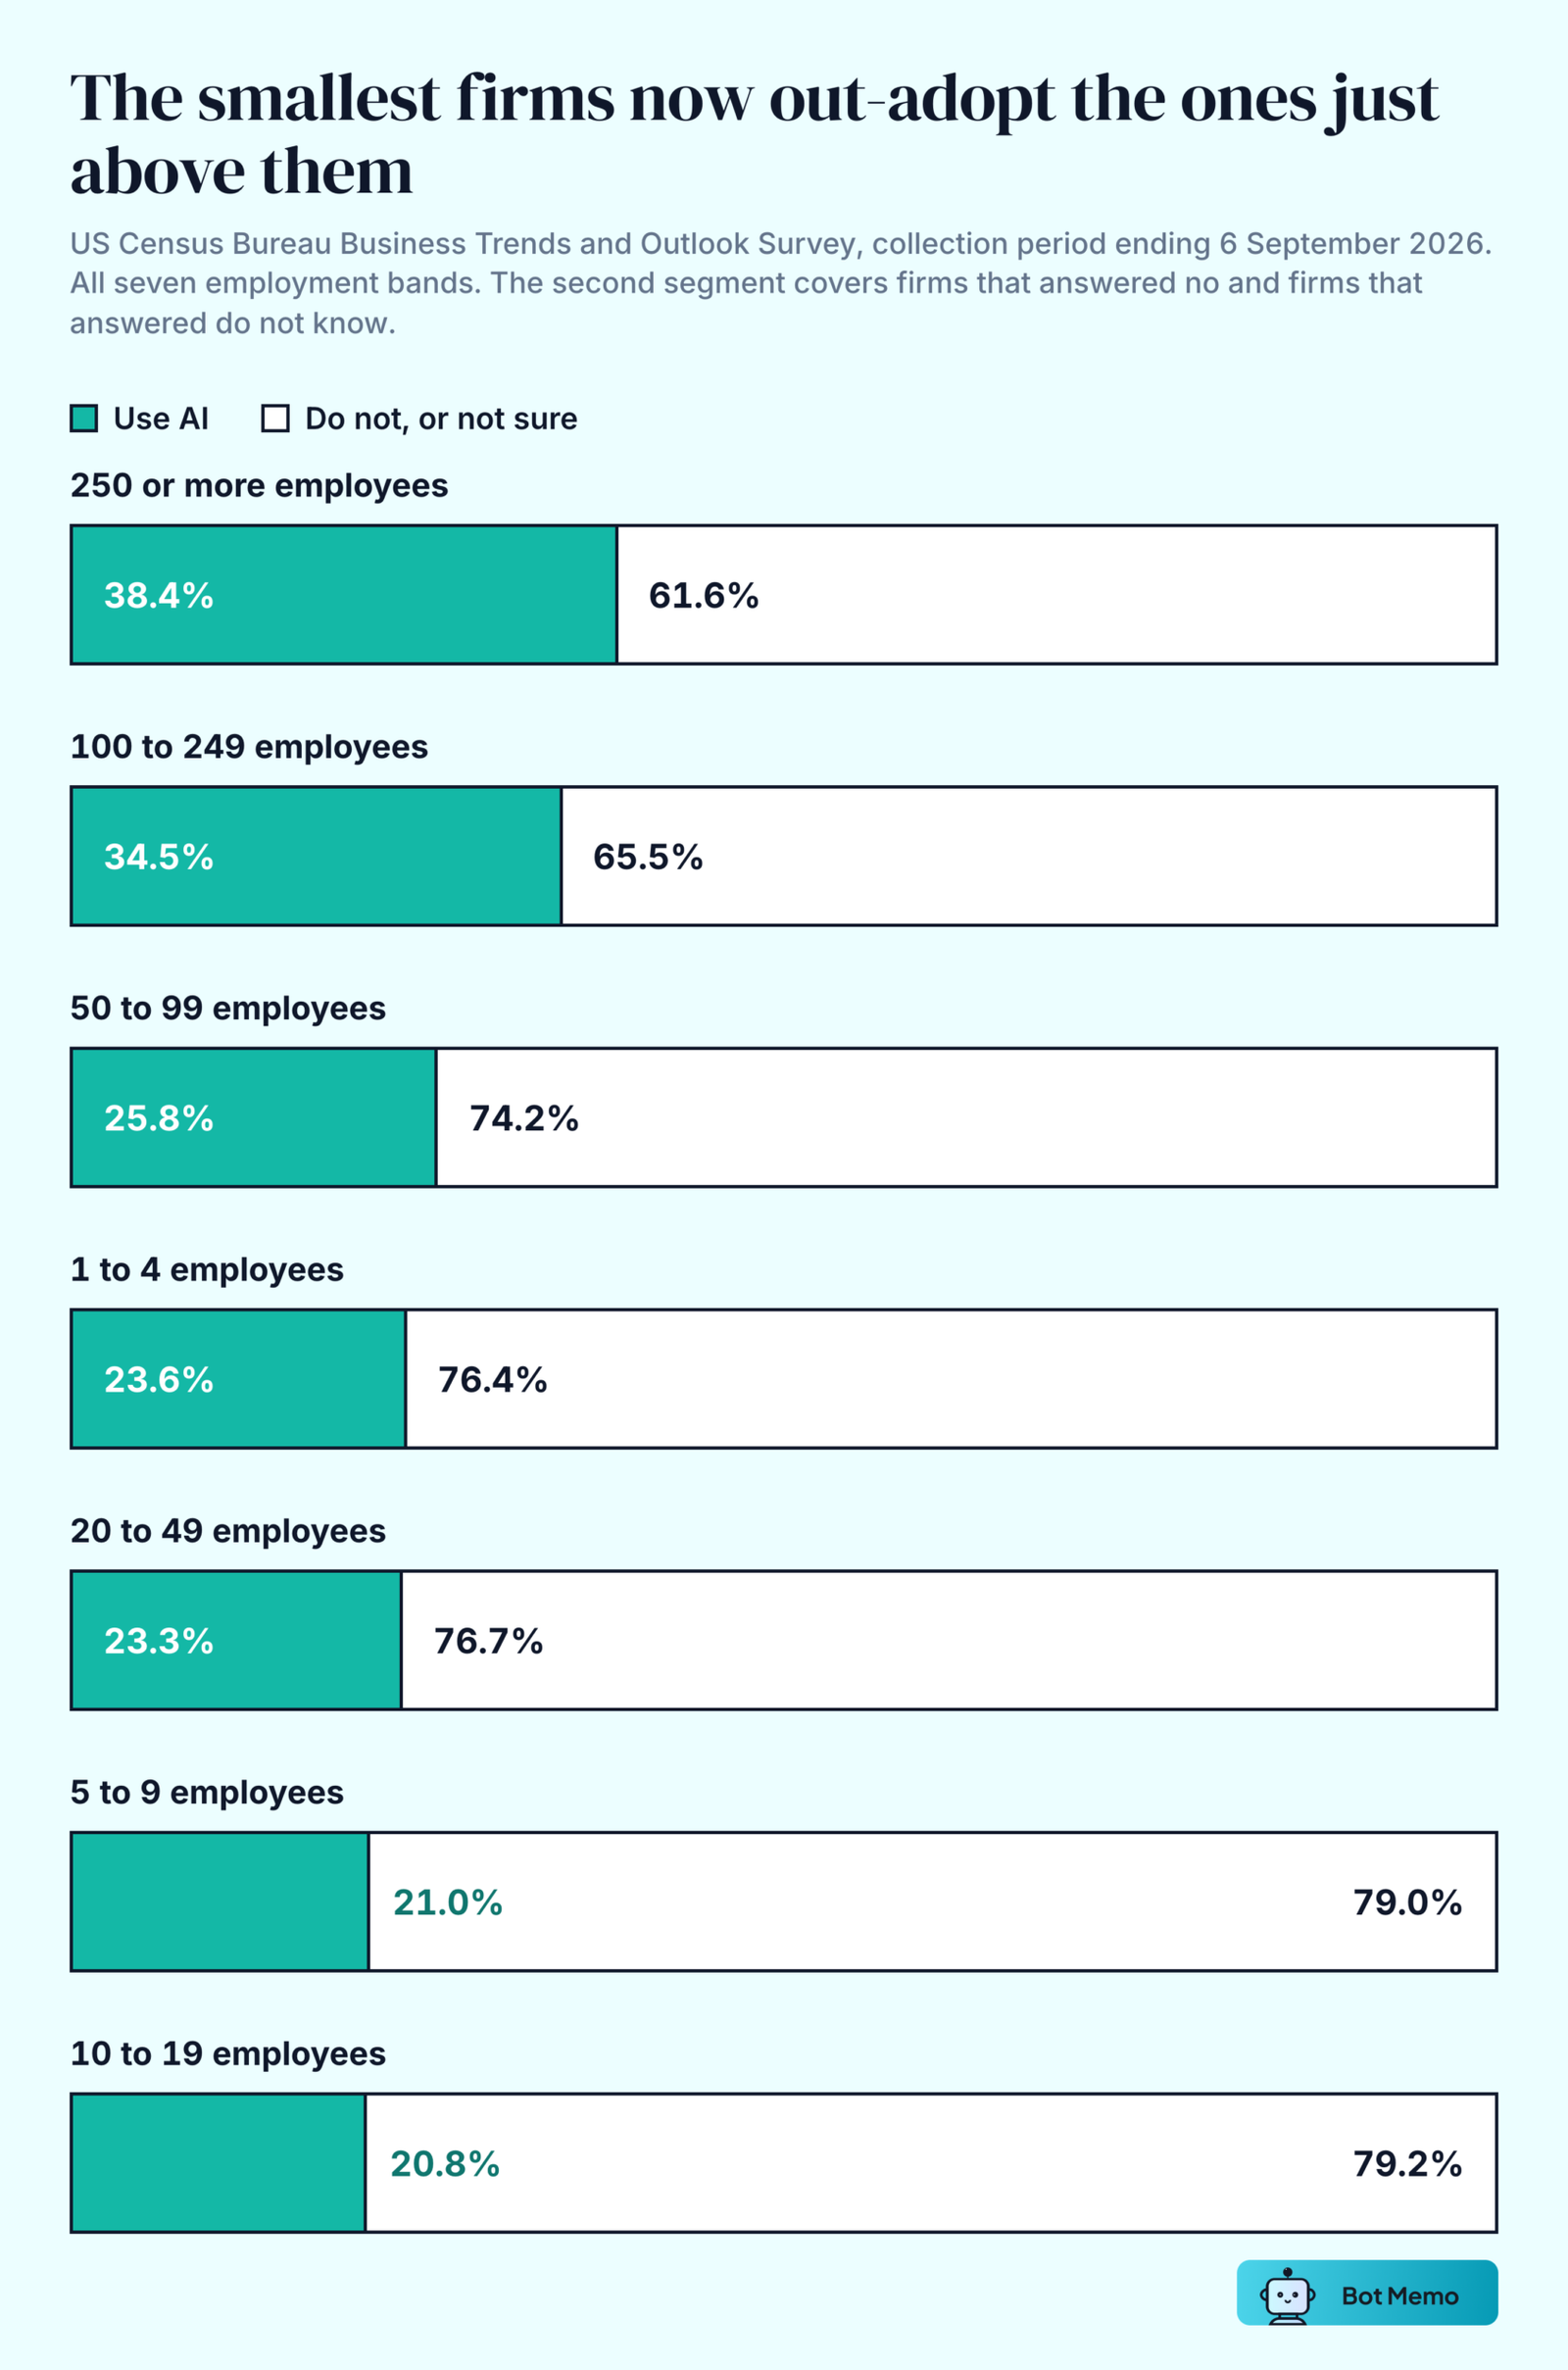
- 38.4% of US firms with at least 250 employees report using AI. The gradient is no longer a clean climb: firms with four or fewer employees report 23.6%, above the 21.0% and 20.8% of the two size classes just above them. (US Census Bureau, period ending 6 September 2026)
- 34.5% of firms with 100 to 249 employees report using AI, and 25.8% of those in the size class below it.
- By sector, Information leads at 43.5% current use with Professional, Scientific and Technical Services effectively level at 43.3%. Finance and Insurance follows at 36.5%, Retail Trade at 15.5% and Accommodation and Food Services at 8.5%.
- 54% of respondents at organisations above $1 billion in revenue report scaling AI across the enterprise, against about a third at smaller organisations. (McKinsey, August 2026)
- Across the OECD, large enterprises adopt at 52.0% against 17.4% for small ones, and the ICT sector leads at 57.3%. (OECD, 2025 reference data)
Adoption Varies Widely By Country
- The OECD average enterprise adoption rate reached 20.2% in 2025, up from 14.2% in 2024 and 8.7% in 2023.
- Denmark leads European adoption at 42.0%, followed by Finland at 37.8% and Sweden at 35.0%. Romania sits at 5.2% and Poland at 8.4%. (Eurostat, 2025)
- On consumer generative AI use, Singapore reaches 61% and the United Arab Emirates 64%, while the United States ranks 24th at 28.3%. (Stanford HAI AI Index 2026)
- Generative AI reached 53% adoption within three years of ChatGPT’s release, faster than the personal computer or the internet did. (Stanford HAI AI Index 2026)
AI Investment And Market Size Statistics
Private AI Investment More Than Doubled In 2025
- Global corporate AI investment reached $581.7 billion in 2025, a 130% rise on 2024. (Stanford HAI AI Index 2026)
- Private AI investment reached $344.7 billion, up 127.5%.
- US private AI investment was $285.9 billion, about 23 times China’s $12.4 billion.
- Generative AI investment grew by more than 200% and took nearly half of all private AI funding.
- The count of newly funded AI companies rose 71%, and billion-dollar funding events nearly doubled.
- The United States produced 1,953 newly funded AI companies in 2025, more than ten times the next country.
- Alphabet spent $91.4 billion on property and equipment in 2025, up from $52.5 billion in 2024. (Alphabet Form 10-K, filed February 2026)
- US government AI contracts and grants totalled about $20.4 billion between 2013 and 2024, against $285.9 billion of private investment in 2025 alone. (Stanford HAI AI Index 2026)
Where The Money Concentrates
- Bot Memo’s repository recorded $513.3 billion across 3,860 AI startup rounds between January and July 2026, more than the $297.7 billion across 5,421 rounds recorded for all of 2025.
- The same repository recorded $124.2 billion across 3,469 rounds in 2023 and $207.7 billion across 4,649 rounds in 2024.
- The median AI round in that repository has barely moved. It sat at $11.0 million in Q1 2023 and $10.5 million in Q2 2026, never leaving a $10.0 million to $13.0 million band across fourteen quarters.
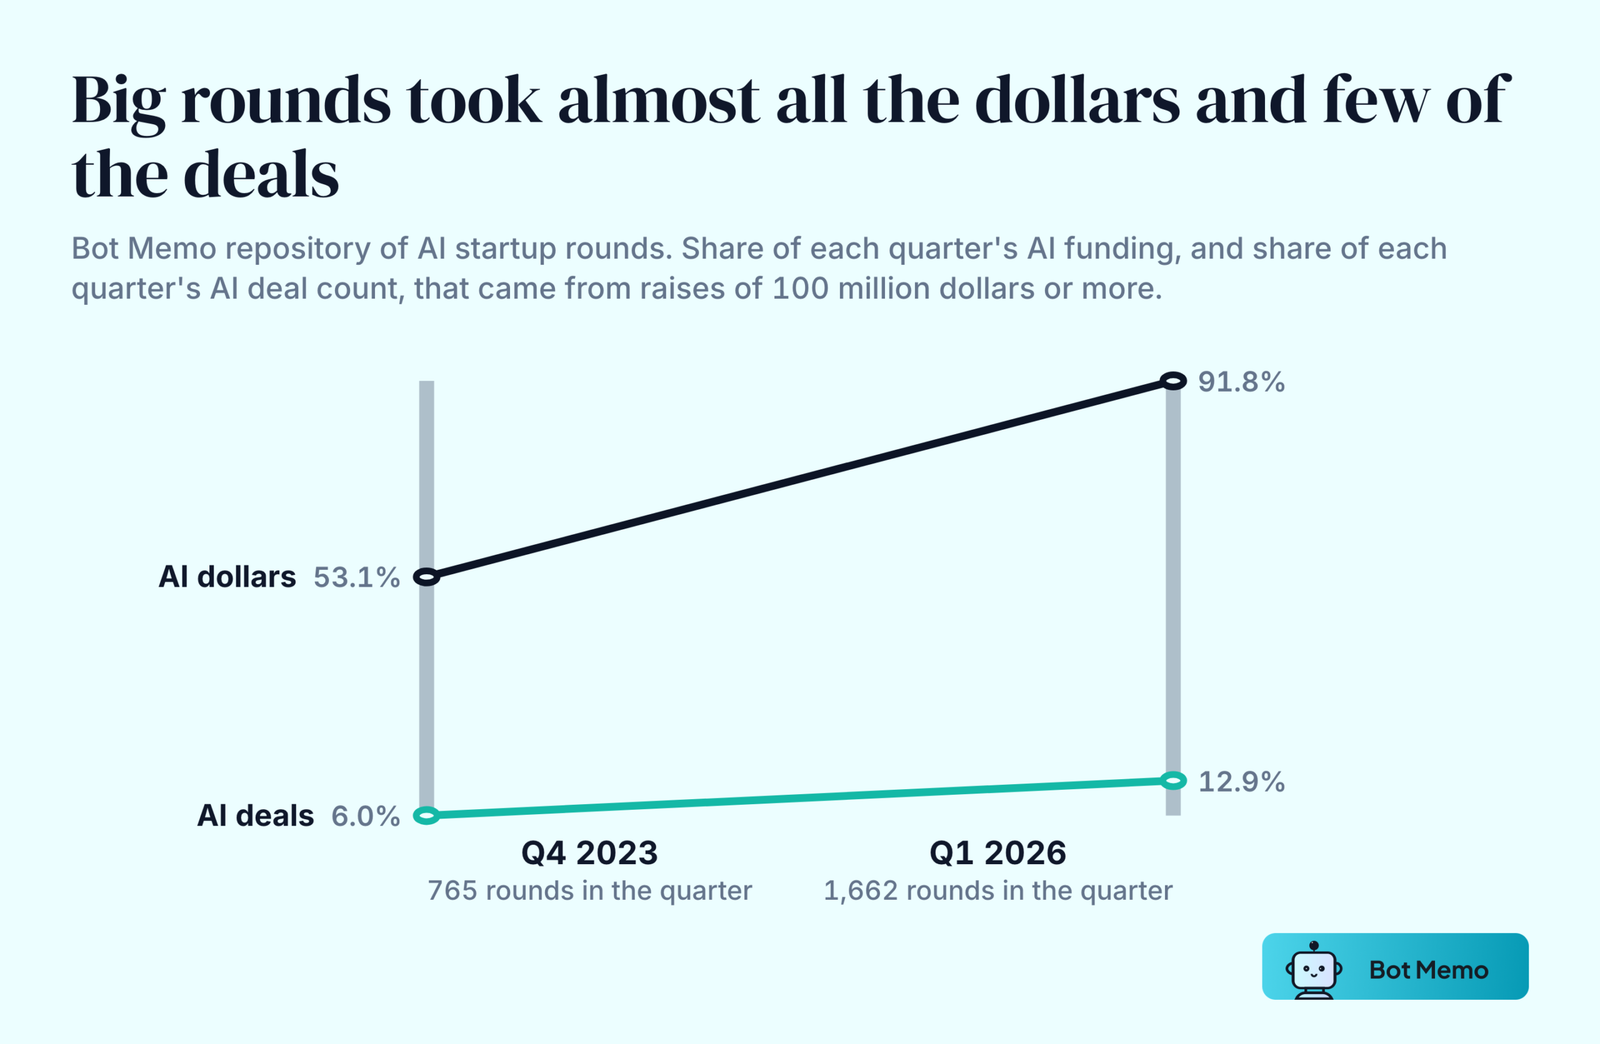
- Rounds of $100 million or more took 53.1% of the repository’s AI dollars in Q4 2023 and 91.8% in Q1 2026.
- The count of $100 million-plus rounds went from 59 in Q1 2023 to 215 in Q1 2026. Q4 2023 carried 765 rounds in total and Q1 2026 carried 1,662.
- March 2026 alone carried $167.1 billion of that total, more than the whole of 2023, on 598 rounds.
Older Forecasts That Still Circulate
- Grand View Research valued the global AI market at $136.55 billion in 2022 and projected $196.63 billion for 2023 rising to $1,811.75 billion by 2030, a 37.3% compound annual growth rate. (Grand View Research, July 2023) The same page now carries a 2025 reading of $390.9 billion, a 2026 estimate of $539.5 billion and a 2033 forecast of $3,497.3 billion at a 30.6% growth rate.
- The Insight Partners put the AI chip market at $5,658.1 million in 2018, projected to reach $83,252.7 million by 2027 at a 35% compound annual growth rate. (The Insight Partners)
- PwC’s Sizing the Prize estimated AI would add up to $15.7 trillion to the global economy by 2030. China was projected to gain 26% of GDP and North America 14.5%. (PwC, 2017)
- That $15.7 trillion splits, in PwC’s own accounting, into $6.6 trillion from productivity gains and $9.1 trillion from consumption-side effects. The share of the total attributed to productivity is often quoted as 55%; PwC’s own split works out at about 42%.
- McKinsey’s economic potential work put generative AI’s annual value at $200 billion to $340 billion in banking and $400 billion to $660 billion in retail and consumer packaged goods. (McKinsey, June 2023)
- These four forecasts are still widely quoted. All predate the 2025 investment surge, and all are projections rather than measured revenue.
Market Size Estimates Depend Entirely On Definition
- Published estimates of “the AI market” span roughly $37 billion for what enterprises actually spent on generative AI in 2025 (Menlo Ventures, December 2025) to $2.3 trillion for a 2032 total addressable market covering hardware, software, services and adjacent categories (Bloomberg Intelligence, June 2026, raised from $1.3 trillion in 2023 and $1.8 trillion in 2025). One is a year of measured spend, the other a forecast eight years out. The spread is a definition problem, not a data-quality one.
- The same applies to investment. Stanford’s AI Index reports $581.7 billion of global corporate AI investment for 2025, $344.7 billion of it private, and $285.9 billion of that in the United States. Three defensible answers to “how much went into AI last year”, from one report.
Generative AI And Model Statistics
Frontier Models Now Cluster At The Top
- As of March 2026, Anthropic (1,503), xAI (1,495), Google (1,494), OpenAI (1,481), Alibaba (1,449) and DeepSeek (1,424) all sit in the top tier of Arena Elo ratings. (Stanford HAI AI Index 2026)
- Industry produced more than 90% of notable frontier models in 2025.
- The best model’s lead over the leading Chinese models narrowed to 2.7% by March 2026.
- AI agents completed 77.3% of real-world tasks in a 2026 benchmark, against 20% a year earlier.
- AI agents handling cybersecurity problems on the Cybench benchmark solved them 93% of the time, against 15% in 2024. (Stanford HAI AI Index 2026)
- Robots managed 12% of household tasks.
- The average Foundation Model Transparency Index score fell to 40 points, down from 58 in the previous edition.
Inference Costs Collapsed
- The cost of running a model at GPT-3.5 level on the MMLU benchmark fell from $20.00 per million tokens in November 2022 to $0.07 per million tokens by October 2024, a 280-fold drop in under two years. (Stanford HAI AI Index 2025)
- Depending on the task, Epoch AI estimates large language model inference costs fall between 9 and 900 times per year.
Agents Reached Production In A Narrow Band Of Functions
- 40% of respondents at organisations above $1 billion in revenue report scaling AI agents, up from 27% a year earlier. At smaller organisations the share stayed flat at 22%. (McKinsey, August 2026)
- About two in ten respondents overall report reaching the scaling phase with AI agents.
- Agents are most often scaled in IT, knowledge management and software engineering.
- 32% of respondents say their organisation decided against buying at least one software product or feature because they could build it in-house with agentic coding tools.
- Among AI high performers, that share reaches nearly half, against 31% of other respondents.
AI Usage Statistics: What Consumers Actually Do
44% Of US Adults Use ChatGPT
- 44% of US adults say they use ChatGPT, more than double the 18% who said so in 2023. (Pew Research Center, 17 June 2026, from 5,119 adults surveyed 17 to 23 February 2026)
- 49% of US adults use an AI chatbot of some kind, up from 33% in 2024. 51% use none.
- After ChatGPT come Gemini at 24%, Copilot at 17%, Meta AI at 14%, Grok at 8%, Claude at 6% and Character.ai at 3%.
How Often People Reach For One
- 24% of US adults use a chatbot daily, including 12% several times a day and 4% almost constantly.
- Another 25% use one several times a week or less.
- 60% of US adults say they read AI-generated summaries in search results.
What They Use Them For
- Information search leads at 42%, followed by work tasks at 38% among employed adults, entertainment at 25%, image or video creation at 24%, and medical advice at 20%.
- Asked whether chatbots help or hurt them, 30% of US adults said they help their productivity against 5% who said they hurt it. On creativity the split is 21% helped to 11% hurt. Those shares are of all US adults, about half of whom use no chatbot at all.
- Estimated consumer surplus from generative AI in the United States reached $172 billion a year in early 2026, up from $112 billion, with median value per user roughly tripling. (Stanford HAI AI Index 2026)
Figures From The Earlier Consumer Surveys
- In 2023, 78% of consumers said AI use should be disclosed in digital content, and 69% agreed society would need significant changes to adjust to a post-AI world. (The Verge and Vox Media, 26 June 2023)
- Authority Hacker’s 2023 survey found that among the marketers who had adopted AI, 85.1% used it for blog content, and across the full sample 65.8% thought AI content equal to or better than human writing. (Authority Hacker, April 2023, from 3,812 digital marketers)
- The same survey found 75.7% of marketers used AI tools at work and 81.6% thought content writers’ jobs were at risk.
- Statista projected the installed base of digital voice assistants would reach 8.4 billion units by 2024, against 4.2 billion in 2020. (Statista) That forecast has since passed its horizon.
AI And Jobs Statistics
Expected Job Cuts Ran Far Ahead Of Actual Ones
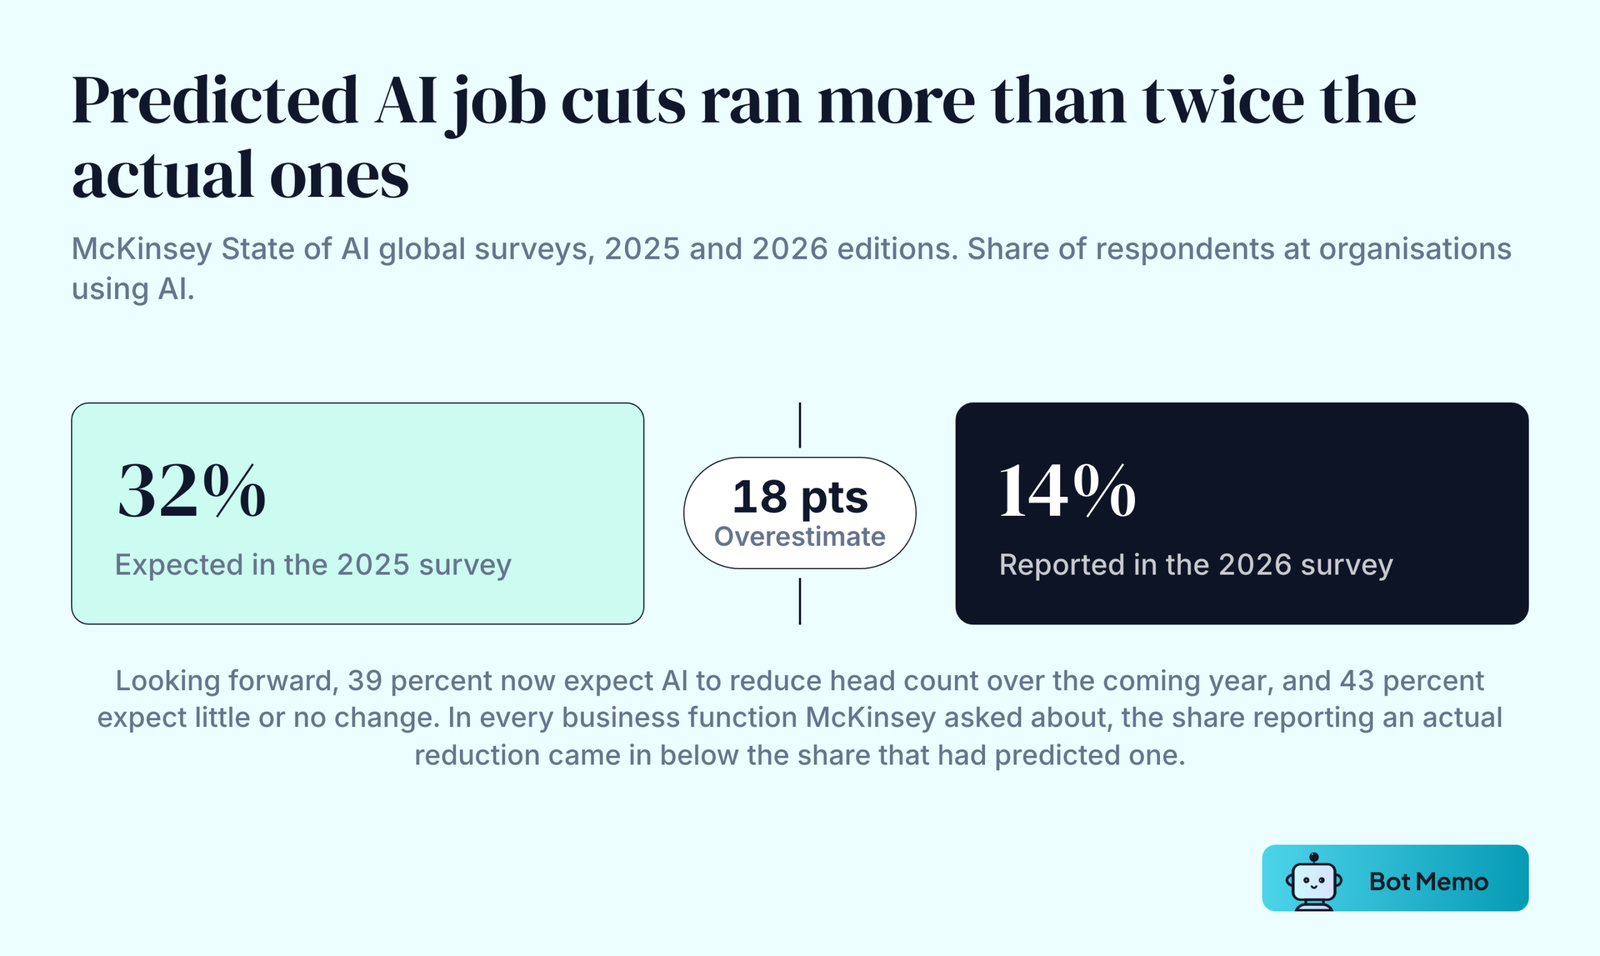
- 14% of respondents at organisations using AI report that AI contributed to an overall decline in workforce size over the past year. In the prior year’s survey, 32% expected exactly that. (McKinsey, 25 August 2026)
- 39% now expect AI to reduce head count over the coming year, and 43% expect little or no change.
- In every business function McKinsey asked about, the share reporting actual reductions came in below the share that predicted them a year earlier.
- Employment of software developers aged 22 to 25 had fallen close to 20% below its 2022 peak by September 2025. (Stanford HAI AI Index 2026)
Measured Productivity Gains Are Real And Narrow
- Productivity gains run 14% to 15% in customer support, 26% in software development and up to 50% in marketing output. (Stanford HAI AI Index 2026)
- 80% of McKinsey’s 2026 respondents say AI improved their individual productivity, and 50% say it helps them make better decisions.
- About half also say AI has helped them develop new skills. (McKinsey, August 2026)
- 47% of mid-level managers and individual contributors report at least one negative effect from AI at work, against 31% of executives and senior managers.
The Widely Quoted Job Projections
- The World Economic Forum projects 170 million new roles and 92 million displaced roles by 2030, a net gain of 78 million, from a survey of more than 1,000 employers representing over 14 million workers across 55 economies. Those figures cover every macrotrend the report models, among them the green transition and demographic change, not AI alone. (World Economic Forum, January 2025)
- Its 2023 edition, still widely cited, put 44% of workers’ skills as disrupted over the following five years and projected 42% of business tasks automated by 2027. (World Economic Forum, 30 April 2023)
- Goldman Sachs estimated in March 2023 that generative AI could expose the equivalent of 300 million full-time jobs to automation, with roughly two-thirds of US occupations exposed to some degree. (Goldman Sachs)
- Resume Builder’s 2023 survey of US companies using or planning to use AI found 44% expected layoffs in 2024. (Resume Builder) It asked a US sample what it expected, so it is not directly comparable to the global measurements above.
AI Trust, Sentiment And Regulation Statistics
Optimism Rose, And So Did Nerves
- Globally, the share saying AI offers more benefits than drawbacks rose from 55% in 2024 to 59% in 2025, while the share saying AI makes them nervous rose two points to 52%. These are 30-country figures, and the US sits below the global average on the questions below. (Ipsos, published in the Stanford HAI AI Index 2026)
- 33% of Americans said AI would make their own job better, against a 40% global average. (Stanford HAI AI Index 2026, Ipsos data)
- Asked about the next twenty years, 40% of US adults expect a negative effect on society and 16% a positive one. On their personal lives the split is 31% negative to 23% positive. (Pew Research Center, June 2026)
- 63% say AI is advancing too quickly. 19% say the pace is about right and 2% say it is too slow.
- Among adults aged 18 to 29, 48% expect a negative effect on society, against 38% of those aged 50 to 64 and 35% of those 65 and over. Older adults are also likelier to say they are not sure.
Confidence In Oversight Is Low
- 71% of US adults expect AI to make personal information less secure. 3% expect the opposite.
- 67% lack confidence in the US government to regulate AI effectively, up from 62% in 2024.
- 59% do not trust US companies to develop AI responsibly.
- US trust in government AI regulation was the lowest of any country surveyed, at 31%. (Stanford HAI AI Index 2026)
Governments Are Paying More Attention Than They Are Paying
- AI-related witnesses in US congressional hearings rose from 5 in 2017 to 102 in 2025, with industry’s share rising from 13% to 37% while academia’s fell to 15%. (Stanford HAI AI Index 2026)
- European public AI commitments totalled about $3.7 billion between 2013 and 2024, led by the United Kingdom at $1.6 billion, Germany at $505 million and France at $320 million.
- State-backed AI supercomputing clusters in Europe and Central Asia grew from 3 in 2018 to 44 in 2025.
- Data localisation measures in force through 2024 numbered 77 across East Asia and the Pacific, 71 across sub-Saharan Africa, 66 across Europe and Central Asia, and 3 across North America.
Key Takeaways
- The adoption gap is a question-wording gap before it is anything else. One survey asks a self-selected global panel whether their organisation uses AI anywhere. The other asks a representative sample of US employers a narrower question, with a do-not-know option, that until November 2025 covered only production use. Different questions, different populations, different answers.
- Scale, not adoption, is where the numbers thin out. 44% report AI scaling across the enterprise, 37% report any EBIT impact, and 6% qualify as high performers. That last figure has not moved in a year.
- Money is concentrating faster than usage. In Bot Memo’s repository, rounds of $100 million or more took 91.8% of AI dollars in Q1 2026, against 53.1% in Q4 2023, while the median round stayed inside a $10 million to $13 million band.
- Predicted job losses ran more than twice actual ones. 32% expected AI-driven head-count declines; 14% reported them. The forecast for the coming year is higher again, at 39%.
- Individual productivity gains are widely reported and organisational returns are not. 80% say AI made them personally more productive while the share of organisations reporting EBIT impact stayed flat.
- Consumer adoption is now mainstream and consumer trust is not. 49% of US adults use a chatbot, 63% think AI is moving too fast and 67% doubt the government can regulate it.
Frequently Asked Questions
What Percentage Of Companies Use AI In 2026?
It depends on who is asked. McKinsey’s August 2026 survey of 1,719 respondents across 97 nations found nearly nine in ten reporting regular use in at least one business function. The US Census Bureau, surveying about 200,000 employers every two weeks, measured 23.2% in the period ending 6 September 2026. The UK has two official readings, 16% from a Department for Science, Innovation and Technology survey fielded in spring 2025 and about 35% from an Office for National Statistics survey run in June 2026 on a wider size threshold. Eurostat measured 20.0% for the EU. The consulting figure counts any use, anywhere, reported by a self-selected global panel. The government figures come from representative samples of employers in one country each, and their wording stayed narrower for far longer. The two are not measuring the same thing.
How Much Money Went Into AI In 2025?
Global corporate AI investment reached $581.7 billion, of which $344.7 billion was private investment, according to Stanford’s AI Index 2026. US private investment alone was $285.9 billion, about 23 times China’s $12.4 billion. Generative AI took nearly half of all private AI funding and grew more than 200% on the year.
How Many Americans Use AI?
Pew Research Center, surveying 5,119 US adults in February 2026, found 49% use an AI chatbot and 44% use ChatGPT specifically. About 24% use one daily. Just over half use none at all.
Is AI Actually Cutting Jobs?
Less than expected so far. Of organisations using AI, 14% reported that AI contributed to a decline in workforce size over the past year, against the 32% who had predicted one. Employment of software developers aged 22 to 25 is the clearest exception, close to 20% below its 2022 peak by September 2025 on Stanford HAI AI Index figures. Looking forward, 39% now expect AI-related head-count reductions in the coming year.
Why Do AI Adoption Statistics Vary So Much?
Three reasons. Definition breadth: the US Census rate moved from about 10% to 17.3% when the question broadened from production use to any business function, though a six-week collection gap in late 2025 means some real growth is mixed into that step. Sample composition: government surveys draw probability samples of all businesses, while consulting surveys draw from opt-in panels of executives already engaged with AI. Sponsor incentive: most of the surveys reporting the highest figures are published by firms that sell AI services.
Which Companies Are Adopting AI Fastest?
Large ones, in knowledge-intensive sectors, though the size gradient has flattened at the bottom. In the US, 38.4% of firms with at least 250 employees report AI use, against 23.6% of firms with four or fewer, which now sit above the two size classes immediately larger than them. Information sits at 43.5% and Professional, Scientific and Technical Services at 43.3%, Finance and Insurance at 36.5%, Retail Trade at 15.5%. Across the OECD, enterprises of 250 or more adopt at 52.0% against 17.4% for those of 10 to 49, a survey that excludes firms under ten employees entirely.
Sources And Methodology
Organisational adoption, scaling, agent and EBIT figures come from McKinsey’s The State of AI: Global Survey 2026, published 25 August 2026, fielded 4 May to 8 June 2026 with 1,719 respondents across 97 nations. It is an opt-in panel of executives and managers weighted toward larger organisations, not a probability sample, and it leaves “adoption” undefined. Read it as an upper bound.
US business-level figures come from the Census Bureau’s Business Trends and Outlook Survey, a biweekly survey of roughly 200,000 employer businesses classified as an experimental data product, with a unit response rate of 10% to 13% through 2026, down from about 17% when the AI question was first asked in September 2023. Its AI question offers yes, no and do not know and, until November 2025, asked only about production use. From that point it covers any business function. UK figures come from the Department for Science, Innovation and Technology’s AI Adoption Research, published 28 January 2026 from 3,500 telephone interviews with private-sector businesses of five or more employees, fielded 12 February to 2 May 2025. The Office for National Statistics measures the same thing on a different instrument and a wider threshold and reports a much higher rate, which is why the two are stated separately rather than blended. EU figures come from Eurostat’s ICT usage in enterprises survey, a stratified probability sample of 157,000 enterprises with ten or more employees, published 11 December 2025. OECD cross-country figures combine national surveys with differing definitions and exclude micro-enterprises and financial services.
Investment, model performance, public opinion and policy figures come from Stanford’s Institute for Human-Centered AI and its 2026 AI Index Report. The Index compiles data from outside providers, among them Epoch AI for compute and cost trends and Ipsos for public opinion, rather than running those surveys itself, so those figures inherit the limitations of the underlying sources.
Consumer figures come from Pew Research Center’s Americans and AI 2026, published 17 June 2026, from 5,119 US adults surveyed 17 to 23 February 2026 through the American Trends Panel. Jobs projections come from the World Economic Forum’s Future of Jobs Report 2025, published January 2025.
Funding figures attributed to Bot Memo come from its own repository of AI startup rounds, covering January 2023 to July 2026. Amounts are normalised to US dollars at the rate applying on the announcement date. The 2026 totals are heavily concentrated in a small number of very large rounds, which is the point of the concentration figures above rather than a distortion of them.
Figures from Grand View Research, The Insight Partners, PwC, Goldman Sachs, The Verge and Vox Media, Authority Hacker, Resume Builder and Statista are retained here with their original values, publishers and dates because they remain widely cited. All are projections or point-in-time surveys from 2017 to 2023. Where the publisher has since restated a figure, or a newer measurement of the same question exists, both appear. The Authority Hacker survey page is no longer served on its own site, so the link points at an archived copy of the original.
Related reading on botmemo.com: how many AI companies there are, AI startup funding statistics, how many companies use AI, ChatGPT statistics, and AI replacing jobs statistics.

About the author
Editorial Staff
The Editorial Staff at Bot Memo is a team of writers, analysts, and AI agents dedicated to mapping the global AI startup ecosystem. Led by Chintan Zalani, the team tracks thousands of funding rounds, classifies companies across verticals, and distills it all into actionable intelligence for investors and founders.